
Our Insights
By sharing and updating vetted and easily gathered data on our dashboard, we aim to promote transparency, enhance accountability and provide opportunities for capacity building and collaboration as well as display achievements of our sector and take our rightful place as a force for good.
Our Latest Analysis
Female representation Within Travel and Tourism
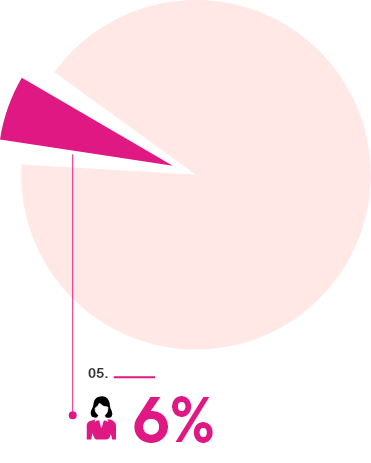
Chair of Board of Directors
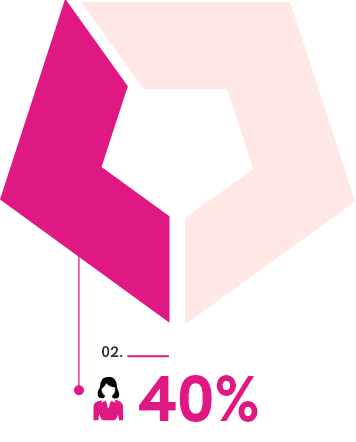
Executive Management
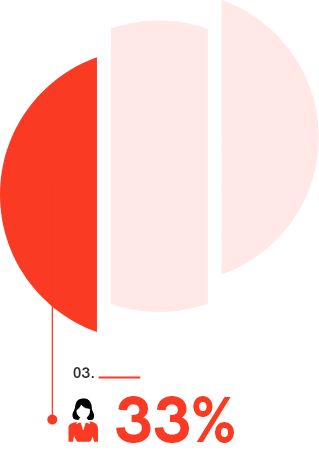
Senior Level Management
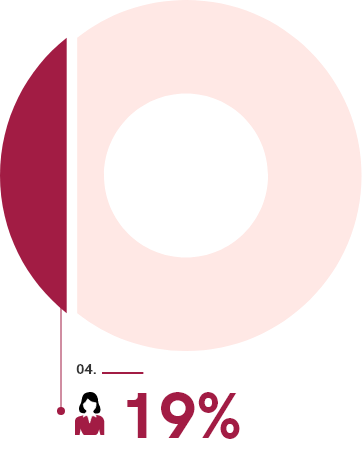
Mid Level Management
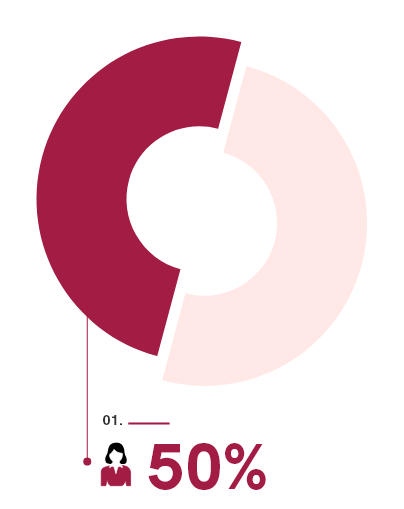
Overall Employment
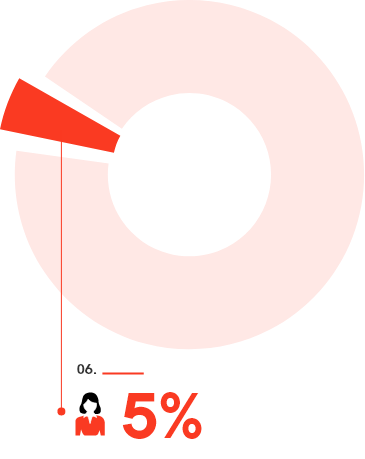
C-Suite
Evolution of Gender Diversity on the Boards and C-Suite
of Travel and Tourism Sector
2007 to 2020

Comparison of Gender Diversity Across 7 Sub-Sectors
Representation of Women in 15 Largest Hotel Companies
Chair
0%
CEO
8%
Executive Mgnt
21%
Senior Mgnt
32%
Mid-Level
43%
Overall Workforce
52%
Representation of Women in 16 Largest Public Casino & Entertainment Companies
Chair
6%
CEO
6%
Executive Mgnt
15%
Senior Mgnt
37%
Mid-Level
44%
Overall Workforce
53%
Representation of Women in 20 Largest Public F&B Companies
Chair
10%
CEO
5%
Executive Mgnt
24%
Senior Mgnt
35%
Mid-Level
51%
Overall Workforce
52%
Representation of Women in 23 Largest Publicly-Listed Airlines
Chair
4%
CEO
0%
Executive Mgnt
15%
Senior Mgnt
35%
Mid-Level
32%
Overall Workforce
46%
Representation of Women in 10 Largest Publicly-Listed Airports
Chair
20%
CEO
0%
Executive Mgnt
16%
Senior Mgnt
33%
Mid-Level
33%
Overall Workforce
33%
Representation of Women in 4 Largest Public Cruise Companies
Chair
0%
CEO
0%
Executive Mgnt
10%
Overall Workforce
23%
Representation of Women in 12 Largest Public OTA & Travel Companies
Chair
0%
CEO
16%
Executive Mgnt
23%
Senior Mgnt
34%
Mid-Level
33%
Overall Workforce
60%
FiveEightTen Originals
Latest Blog
Downloads
Gender Diversity Report 2021

Hoteliers Guild

